
Installation & Setup:
Dogpound Server:
Watchdog
Client:
Renderdog Client: ![]()
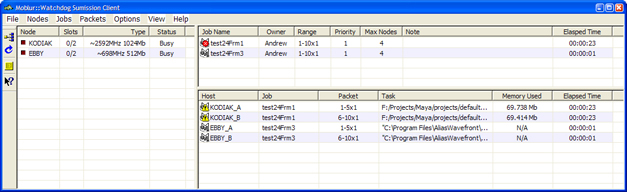
Watchdog Client :: Interface:
| The
default view for the Watchdog Client interface includes 3 panes:
Render Clients, Jobs, and Packets. Any view may be hidden to customize
the interface, up to 2 at a time. Users can also define all colors
used in the interface individually for each view. |
 |
RenderDog Clients:
|
 |
Job View:
The top right view contains the information for all current jobs on the farm including the job name, owner, range, priority, max nodes, notes, and total elapsed time. Jobs can be viewed for the entire farm or the users jobs only by selecting either "View All Jobs" or
"View My Jobs" from the Jobs main menu item. This action will also show only the users current packets. Right clicking in this view brings up the Jobs menu for editing, pausing, and deleting the currently selected job.

Edit Job:
|
 |
Packet View:
The bottom right view contains the information for all current packets on the farm including the processing host, the associated job, the active packet, the current task, current memory used, and the total elapsed time of the packet. Packets can be viewed for the entire farm or the users packets only by selecting either "View All Jobs" or
"View My Jobs" from the Jobs main menu item. This action will also show only the users current jobs. Right clicking in this view brings up the Packets menu for viewing the current frame, viewing the current output, logging into the client with VNC, and killing the selected packet. Viewing the current frame uses the image viewer helper application to open the image.

Colors:
Users can select any possible color combination for each view individually.

Hide Error Flags
This GUI flag toggles the error and warning icon overlays that show which packets or jobs contain error and warning messages. This can be set individually or together for jobs and packets.
Always On Top:
Check this item under the Options main menu item to keep the Watchdog window on top of other windows.
Minimize to Tray
Check this item under the Options main menu item to minimize Watchdog to the system tray when minimized. Left clicking on the tray icon will restore the window, and right clicking on the tray icon will bring up the Submit menu to quickly launch jobs without opening the main window.
Hiding Views:
The Render Node, Job, and Packet views can be hidden together or independently by selecting the "Hide View" sub-menu item from either the "Nodes", "Jobs", or "Packets" main menu items.
Grid Display:
The list view's background grid can be hidden by toggling the "Grid Lines" sub-menu item under the "View" main menu item.
PREVIOUS :: NEXT